Cluster Monitor
The Cluster Monitor provides a real-time overview of the entire HPC cluster. Data refreshes every 10 seconds.
Keyboard shortcut: gc
Sections
Section titled “Sections”| Section | Description |
|---|---|
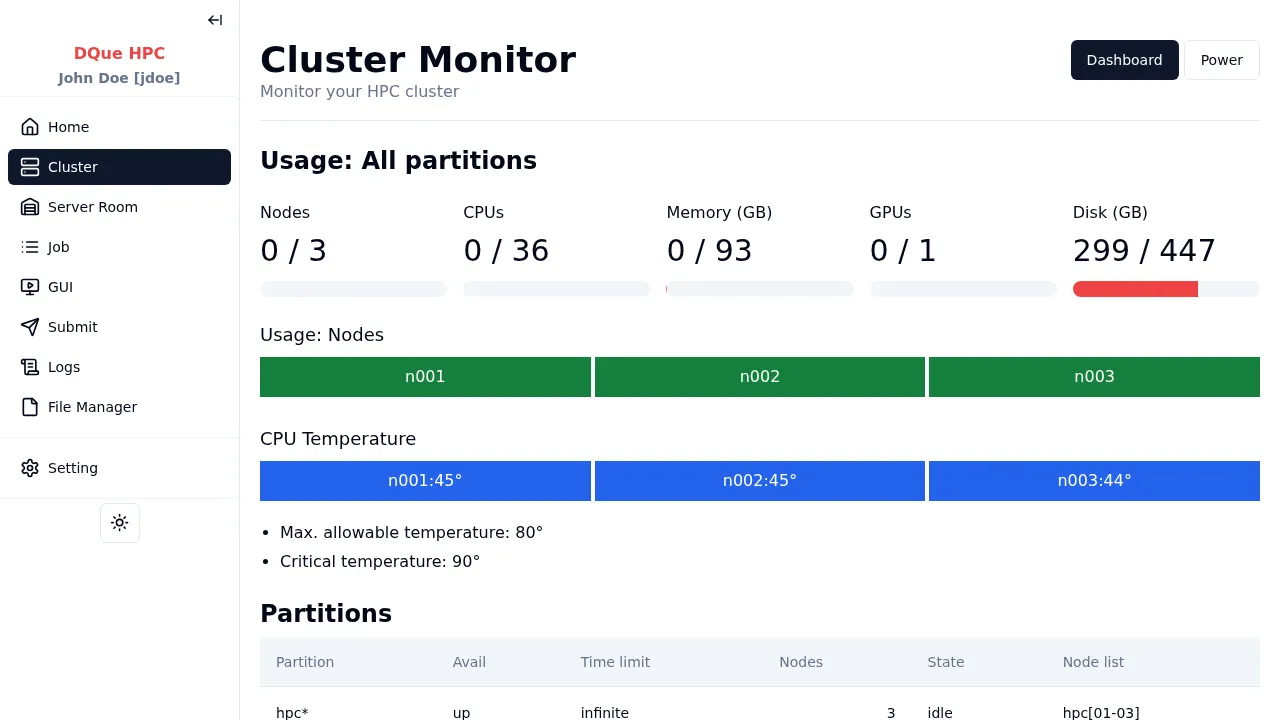
| Usage: All Partitions | Aggregated CPU, memory, and disk utilization across the whole cluster |
| Per-Partition Usage | Individual usage cards for each partition (shown when multiple partitions exist) |
| Usage: Nodes | Color-coded grid showing per-node CPU, memory, and GPU utilization |
| CPU Temperature | Color-coded temperature indicators per node (if enabled by admin) |
| Partitions | SLURM partition table: availability, node counts, job limits |
| Nodes | Detailed node table: state, CPUs, memory, GPUs, features |
If the admin has configured a Dashboard link (e.g., Grafana), a button appears at the top to open it.